Feature available in: PRO plan
Whether for a presentation or a business plan, it can be useful to have all the population data in an Excel file; the file will also include charts and tables. smappen enables you to generate, with a single click, an Excel document summarizing the population data for a catchment area.
If you want to extract the population data for an area, select the area to be analyzed by:
- Clicking on it on the map
- Clicking on its name on the area-management panel
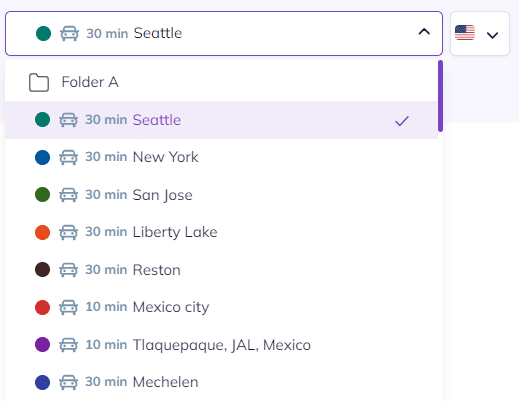
- Selecting it from the drop-down list on the Analytics and data panel
To extract population data for a folder (i.e. all the cities in all the areas included on the folder), select the folder to be analyzed from the drop-down list on the analytics and data panel:
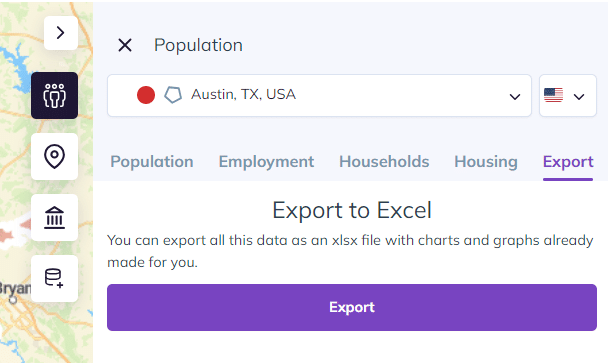
On the analytics and data panel, click on “Population”:

Wait until the extraction is finished, then click on “Export (Excel)”:
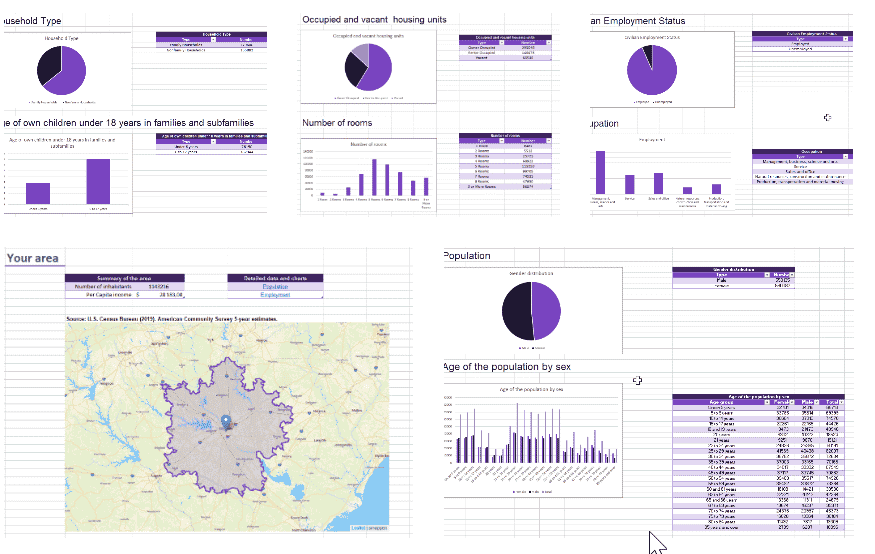
The generated Excel spreadsheet has five tabs:
- Area: contains an image of the area and key data about it
- Population: contains the area’s demographic data
- Employment: contains the employment data for the area
- Housing: contains the housing data for the area
- Household: contains data on the make-up of households in the area
To go further: