Feature available in: PRO PLAN
2 – Click on the “Population” button on the right-hand side of the screen:

1 – Select your area or folder on the map
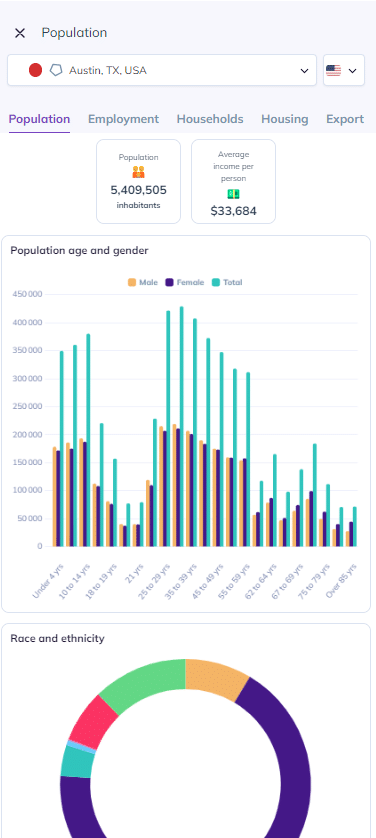
3 – The results are displayed on the right-hand panel:
4 – You can also visualize population densities for your areas in the United States, United Kingdom, in Belgium and France thanks to the Heatmap. To do so, please refer to the dedicated article : VISUALIZING DENSITIES – HEATMAP (US & UK ONLY)
To go further: